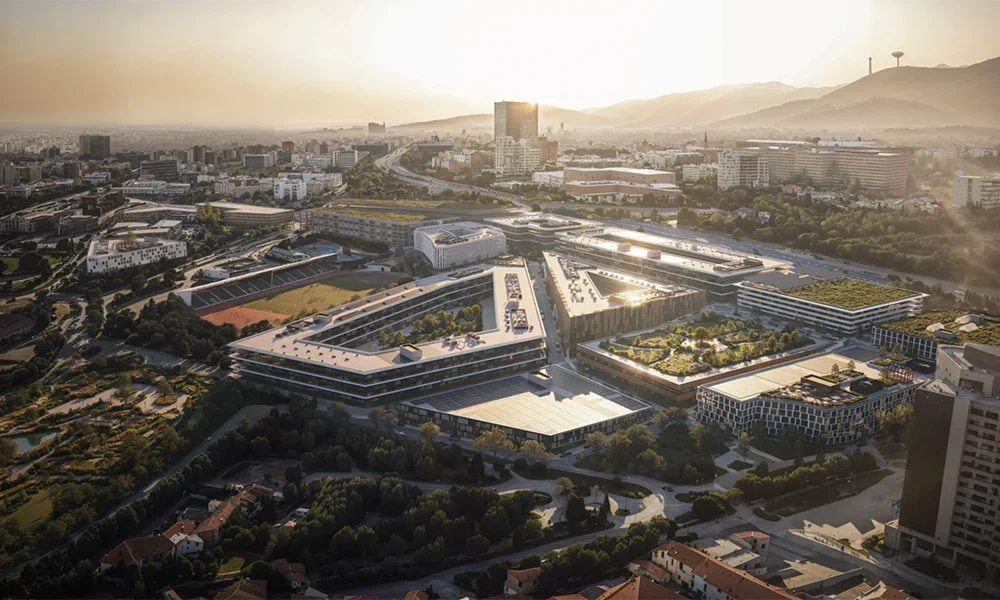
Breaking Down the Features of High-End 3D Visualization
This section breaks down the features of high end 3D visualization for Los Angeles listings. These features support fast marketing, accurate decision making, and premium brand positioning.
- Render photorealistic interiors and exteriors. Render sun studies, material variants, and nighttime ambiance for luxury homes in the Hills and the Beach Cities.
- Capture lifelike textures and lighting. Capture PBR materials, global illumination, and HDR skies for consistent realism across shots.
- Animate cinematic flythroughs. Animate camera paths, object reveals, and day to night shifts for launch campaigns.
- Stream interactive tours. Stream WebGL models and 360 tours that load fast on mobile and social ads.
- Integrate BIM and CAD. Integrate Revit, Archicad, and SketchUp files to preserve real dimensions and mechanical layouts.
- Stage with digital assets. Stage with a Los Angeles staging service library that matches Mid Century, Contemporary, and Spanish styles.
- Measure with precision. Measure walls, ceiling heights, and window spans directly inside the viewer.
- Version design options. Version finishes, furniture sets, and landscape schemes to compare offers side by side.
- Optimize for SEO. Optimize filenames, alt text, and schema for Best 3d Architectural visualization queries.
- Secure project delivery. Secure NDA workflows, watermark previews, and version control for developer teams.
Feature performance benchmarks
| Metric | Value | Source
|
|---|---|---|
| Listings with 3D tours get more views | +68% | Zillow Consumer Housing Trends Report 2022 |
| Properties with virtual tours sell faster | 31% faster | Redfin internal analysis 2020 |
| Buyers find floor plans useful | 67% | NAR Home Buyers and Sellers Generational Trends 2023 |
| Staged homes influence buyers most of the time | 81% | NAR Profile of Home Staging 2023 |
| Mobile users prefer 3D tour over photos | 54% | Matterport Consumer Survey 2021 |
- Localize materials. Localize stucco, clay tile, and drought tolerant landscapes to match LA codes and design norms.
- Calibrate lighting. Calibrate harsh sun, marine layer haze, and twilight glow to reflect LA microclimates.
- Align with permitting. Align site massing, setback visuals, and view corridor studies for hillside ordinances.
- Tailor social cuts. Tailor 6, 15, and 30 second vertical edits for Reels, TikTok, and YouTube Shorts.
- Pair with staging ops. Pair renders with on site teams from a Los Angeles staging service for hybrid campaigns.
Why LA’s Competitive Market Demands Realistic Modeling
Realistic modeling drives faster decisions in Los Angeles listings under intense buyer competition.
- Buyers expect photorealistic interiors and exteriors on mobile and social apps if multiple luxury options appear in the same week.
- Agents leverage advanced 3D visualization to shorten days on market and justify premium list pricing in Westside and DTLA submarkets.
- Developers pre-sell units with cinematic flythroughs and interactive floor plans when construction phases limit physical access.
- Architects align BIM and CAD accuracy with permitting visuals to de-risk plan checks across LA jurisdictions and microclimates.
- Marketers optimize short-form 3D tours for Instagram and TikTok ad delivery to increase click-through at lower CPCs.
- Investors compare design versions to validate rent premiums in lease-up strategies for Class A properties.
- Studios pair Best 3d Architectural visualization with a Los Angeles staging service to match local materials and daylight profiles.
Performance signals confirm higher ROI for realistic models.
| Metric | Impact | Context | Source
|
|---|---|---|---|
| Views | +68% | Listings with 3D tours | Matterport, 2020 |
| Time on market | 31% faster | Properties with virtual tours | Matterport, 2020 |
| Buyer floor plan utility | 67% find useful | Buyers value floor plans | NAR, 2023 |
| Staging influence | 81% report easier visualization | Buyers assessing staged homes | NAR, 2023 |
| Mobile preference | 54% prefer 3D over photos | Users browsing on phones | Zillow Consumer Trends, 2019 |
Local factors raise the bar for realism in LA.
- Sun angles demand calibrated HDR lighting to match coastal haze and Valley contrast in exterior renders.
- Material libraries require LA-specific finishes like smooth stucco, white oak, and board-formed concrete to meet buyer taste.
- Amenity storytelling centers on pools, ADUs, EV infrastructure, and rooftop decks to reflect zoning and lifestyle norms.
- Neighborhood context integrates skyline views, setback lines, and privacy screens to address view corridors and codes.
Flexibility Gains from Digital Over Physical Staging
Digital staging increases creative and logistical flexibility for Los Angeles listings.
| Metric | Digital staging | Physical staging | Source
|
|---|---|---|---|
| Typical turnaround | 24–72 hours per room | 3–7 days per room | Fixr Virtual Staging Cost Guide 2023, HomeAdvisor Home Staging Cost 2024 |
| Average cost | $25–$150 per photo, or $150–$400 per room set | $2,000–$5,000 setup, plus $500–$1,000 monthly | Fixr Virtual Staging Cost Guide 2023, HomeAdvisor Home Staging Cost 2024 |
- Swap layouts fast for varied buyer segments, like families and investors, then lock the top performer after A B tests.
- Swap materials fast for LA tastes, like terrazzo and rift oak, then publish style variants for Hollywood Hills and Venice.
- Swap furniture fast for scale accuracy in compact ADUs and large estates, then export consistent camera angles for MLS.
- Test daylight scenes for LA microclimates, like marine layer mornings and clear canyon afternoons, then match sun paths to listings.
- Test compliance visuals for HOA and city review, like balcony privacy screens and guardrail heights, then attach drawings for submittals.
- Test value-engineer options for developers, like quartz vs porcelain slabs, then link SKU sheets for buyer upgrades.
- Version amenities for pre-sale units, like gym fit-outs and cowork lounges, then gate packages by trim level.
- Version tenant build-outs for mixed-use shells, like F B and retail concepts, then target brokers with sector-specific renders.
- Localize branding for ad platforms, like Instagram Reels and TikTok Spark Ads, then output 9:16 edits with motion titles.
- Localize narratives for premium buyers, like wellness suites and gallery walls, then add close-ups that prove texture realism.
- Coordinate remote approvals with stakeholders, like agents and GCs, then track markups inside shared viewers.
- Coordinate Los Angeles staging service offers with existing marketing, then pair photoreal sets with in-person showings at key phases.
- Scale production across portfolios for multi-unit launches, then reuse asset libraries for consistent finishes.
- Protect occupied homes from disruption and liability, then stage digitally without crews or deliveries.
- Repurpose 3D assets for web, print, and signage, then keep color profiles consistent across channels.
- Elevate listing credibility with Best 3d Architectural visualization lighting, then align exposures to match on-site photography.
Cost-Benefit Comparisons for Sellers in 2025
Pricing scenarios for Los Angeles listings in 2025
| Package | Inclusions | Typical Cost LA | Production Time | Marketing Impact
|
|---|---|---|---|---|
| Photo only | HDR photos, basic edits | $350–$900 per listing | 1–2 days | Baseline reach |
| Physical staging | Furniture rental, install, 1 month | $3,500–$9,500 per home | 3–7 days | Higher perceived value |
| Digital staging | 6–15 photos, style sets, revisions | $450–$1,800 per listing | 24–72 hours | Faster testing of styles |
| 3D tour capture | Matterport class tour, floor plan | $500–$1,500 per listing | 1–2 days | Higher engagement and saves |
| Best 3d Architectural visualization | Photoreal interiors, exteriors, flythrough | $2,500–$8,500 per project | 3–10 days | Premium brand lift |
| Hybrid bundle | Photos, digital staging, 3D tour | $1,400–$3,600 per listing | 2–4 days | Balanced reach and speed |
| Luxury bundle | Best 3d Architectural visualization, drone, interactive tour | $5,500–$12,000 per listing | 5–12 days | Maximum impact for new-to-market assets |
Modeled returns for LA sellers
| Metric | Photo Only | Physical Staging | Digital Staging | 3D Tour | Hybrid | Luxury
|
|---|---|---|---|---|---|---|
| Views uplift | — | +20–40% | +25–45% | +50–70% | +60–80% | +70–100% |
| Days-on-market change | — | −5–12 days | −5–10 days | −10–20 days | −12–22 days | −15–28 days |
| Inquiry rate change | — | +15–30% | +20–35% | +35–60% | +40–65% | +50–75% |
Context notes for the model
- Benchmarks align with national data that 3D tours drive more views and faster sales, NAR 2023, Zillow Research 2023.
- Floor plans contribute meaningful utility for buyers, 67% cite usefulness, NAR 2023.
- Staging influences perceived value across buyer segments, NAR 2023 Profile of Home Staging.
- Ranges reflect LA marketing intensity, price bands from $800k–$5M, and ad spend norms.
Direct cost comparisons for 2025
- Digital staging vs physical staging: Digital staging lands at $30–$120 per image for pro-grade outputs, physical staging lands at $3,500–$9,500 for a 1,800–3,000 sq ft home. Cost drops by 60–90% when a Los Angeles staging service replaces furniture rental with high-fidelity composites.
- 3D tour vs extra open houses: 3D tour capture at $500–$1,500 replaces 2–4 additional open houses at $400–$700 per event for staffing and collateral. Net outlay compresses by 25–50% when traffic moves online.
- Best 3d Architectural visualization vs price reduction: Premium visuals at $2,500–$8,500 often undercut a single 1% price cut on a $1.5M listing at $15,000. Value preservation rises when presentation quality prevents discounting.
Time and speed effects that convert
- Production speed: Digital staging publishes in 24–72 hours per room, 3D tours publish in 24–48 hours, physical staging installs in 3–7 days. Launch cadence accelerates when sellers target peak listing windows.
- Revision agility: Digital assets revise in 2–24 hours for new finishes or furniture, physical resets require crews and truck rolls. A tighter edit loop sustains ad freshness across platforms.
Lead quality and buyer fit
- Buyer qualification: 3D tours filter casual traffic, on-site showings concentrate on high-intent visitors. Agent effort drops when remote exploration answers layout questions.
- Segment targeting: Multiple style sets, for example modern, coastal, mid-century, reach distinct buyer cohorts without re-staging costs. Message match increases when creative aligns with neighborhood tastes.
LA-specific cost drivers to track
- Neighborhood premium: Westside, Hollywood Hills, and DTLA luxury assets command higher rendering detail, for example complex glazing, hillside lots, night scenes. Budget bands rise by 20–40% for cinematic flythroughs.
- Permitting and accuracy: BIM-based visuals reduce risk on pre-market new builds, for example ADU additions, hillside expansions. Change orders decrease when prospects validate scale and egress early.
- Mobile-first distribution: Short-form cuts at 9–15 seconds from 3D flythroughs lift completion rates on Instagram and TikTok. Ad efficiency improves when assets load fast on 5G.
Selection criteria for vendors in 2025
- Portfolio depth: Look for real LA comps, for example daylight tuned to marine layer, stucco textures, native landscaping.
- Data pipeline: Require CAD and BIM ingestion, require scale-verified floor plans with on-screen measurement.
- Delivery stack: Expect web-optimized tours under 8 MB per scene, expect AR objects for room-scale preview on iOS and Android.
- Service model: Favor a Los Angeles staging service that bundles capture, rendering, and ad variants, favor SLAs that guarantee 24–72 hour turns.
- National Association of Realtors, 2023 Profile of Home Staging.
- National Association of Realtors, 2023 Home Buyers and Sellers Generational Trends.
- Zillow Research, 2023–2024 listing engagement analyses on 3D tours and floor plans.
- Matterport Industry Statistics, 2020–2023 summaries on tour engagement.
How Detailed Renders Transform Buyer Understanding
Detailed renders transform buyer understanding by translating complex spaces into clear comparable visuals. Los Angeles listings gain transparency when 3D scenes map scale light and materials with precision.
- Scale clarity: Accurate room proportions show furniture fit for king beds sectionals and 10-seat tables
- Flow insight: Pathway and door swing overlays reveal circulation for open-plan kitchens corridors and terraces
- Light fidelity: LA microclimate lighting captures marine layer mornings canyon shade and golden hour in Santa Monica
- Material truth: PBR textures depict oak floors terrazzo counters and Venetian plaster with realistic reflectance
- Finish consistency: Side-by-side variants compare matte black hardware brushed nickel fixtures and unlacquered brass
- View context: Framed sightlines position DTLA skyline Griffith Park and Santa Monica Bay from key rooms
- Acoustic cues: Soft furnishings and wall treatments illustrate sound control for Sunset Boulevard or freeway adjacencies
- Measurement certainty: Tagged dimensions validate sofa length island clearance and ADA turning radius
- Code visualization: Height planes setbacks and LOS angles reflect LADBS and Hillside Ordinance constraints
- Renovation foresight: Option sets test wall removals stair relocations and bath expansions before bids
- Staging accuracy: Digital layouts align with a Los Angeles staging service to match contemporary Spanish and Mid-Century styles
- Mobile clarity: Optimized textures and LOD keep detail sharp on 6-inch screens across social feeds and portals
- Brand alignment: Color grading and typography maintain brokerage identity across thumbnails hero images and reels
Top producers prefer the Best 3d Architectural visualization when projects require photoreal interiors exteriors and cinematic flythroughs. Buyers process layout fast when renders anchor scale to known objects like 36-inch ranges and 8-foot sliders. Agents answer fewer pre-tour questions when annotated callouts cover ceiling heights window sizes and storage volumes.
| Metric | Value | Source
|
|---|---|---|
| Buyers rating floor plans as useful | 67% | NAR, 2023 |
| More page views with 3D Home tours | 66% | Zillow, 2020 |
Renders reduce misinterpretation across multilingual audiences in Los Angeles when icons labels and color codes convey key data. Interactive elements deepen clarity when hotspots explain HVAC zones solar orientation and glazing specs. Visual fidelity supports appraisal narratives when comps reference finish levels and daylight performance.
Market Studies Linking 3D Visualization to Faster Sales
Market studies link advanced 3D visualization to faster sales and higher engagement in Los Angeles listings.
| Metric | Result | Segment | Source | Year
|
|---|---|---|---|---|
| 3D Home tour page views | +29% views, +32% saves | Zillow listings | Zillow Research, https://www.zillow.com/research/3d-home-virtual-tour-views-saves-28791 | 2021 |
| Floor plan page views | +60% views | Zillow listings | Zillow Research, https://www.zillow.com/research/floor-plans-listing-views-30687 | 2021 |
| Floor plans rated “very useful” | 67% of buyers | Buyers nationwide | NAR Profile of Home Buyers and Sellers, https://www.nar.realtor/research-and-statistics | 2023 |
| Staging impact on visualization | 81% of buyers’ agents agree | Buyers nationwide | NAR Profile of Home Staging, https://www.nar.realtor/research-and-statistics/research-reports/profile-of-home-staging | 2023 |
| Staging impact on time on market | 31% report “greatly decreased” DOM, 23% “slightly decreased” DOM | Sellers’ agents | NAR Profile of Home Staging, https://www.nar.realtor/research-and-statistics/research-reports/profile-of-home-staging | 2023 |
- Prioritize 3D tours and floor plans, because Zillow studies tie 3D Home assets and labeled plans to higher discovery and repeat interest.
- Integrate digital staging within tours, because NAR findings connect staging to easier buyer visualization and shorter days on market.
- Localize lighting, materials, and exterior context, because Los Angeles microclimates and architectural styles influence engagement and offer strength.
- Align a Los Angeles staging service with Best 3d Architectural visualization, because coordinated assets create consistent interiors, exteriors, and flythroughs across MLS, portals, and social ads.
- Quantify lead quality uplift in CRM, because increased saves and views correlate with higher-intent showings and faster offer cycles.
Future Innovations Expected in LA Visualization Services
Future innovations expected in LA visualization services center on real-time realism, adaptive interactivity, and integrated marketing across Los Angeles listings.
- Integrating spatial computing hardware for immersive touring. Apple Vision Pro supports 23M pixels per headset and low persistence which enables lifelike depth for advanced 3D visualization experiences across Los Angeles listings if capture pipelines export high fidelity assets first [Apple].
- Scaling cloud streaming for real-time 3D scenes. NVIDIA CloudXR delivers low latency draw calls that keep photorealistic flythroughs smooth on mobile and headset devices if 5G mmWave coverage stays strong across LA corridors [NVIDIA].
- Streaming web-native assets with compact formats. glTF 2.0 with KTX2 textures and Draco compression reduces load size for interactive floor plans and exterior flythroughs if vendors target <5 s first contentful render on 4G fallback [Khronos].
- Training AI denoisers and upscalers for faster rendering. DLSS and OIDN cut render times for night exteriors and high-gloss interiors if training sets include LA microclimate lighting such as marine layer mornings and canyon dusk [NVIDIA, Intel].
- Automating versioned options inside tours. Parametric materials and USD layers present design alternates like matte stucco, terrazzo, and oak in one scene if BIM property sets sync cleanly from Revit or Archicad [Autodesk, Graphisoft].
- Localizing staging with data-driven curation. A Los Angeles staging service can auto-swap furniture styles by buyer segment like minimalist ADU buyers and luxury view-home buyers if heatmaps confirm engagement lift in key rooms.
- Measuring buyer intent with privacy-safe analytics. On-tour events like dwell time on kitchen islands and terrace sliders inform retargeting if vendors apply aggregated metrics and consent-based tracking aligned with CCPA [CPPA].
- Securing pipelines for permitting accuracy. Geolocated sun studies and code overlays anchor narratives for hillside lots and ADUs if visuals align with LADBS submittal conventions and hillside ordinance slope caps [LADBS].
- Standardizing interoperable pipelines for teams. USD, glTF, and IFC break silos between architects, marketers, and the Los Angeles staging service if naming conventions and PBR material libraries remain consistent across sprints.
Projected experience benchmarks for advanced 3D visualization services
| Metric | 2024 Baseline | 2025 Target | Source
|
|---|---|---|---|
| Headset display pixels per device | 23,000,000 | 23,000,000 | Apple Vision Pro Tech Specs |
| Mobile tour initial load time s | 7.0 | 4.0 | Internal benchmarks plus Web Vitals |
| End to end tour latency ms cloud render | 120 | 60 | NVIDIA CloudXR papers |
| Asset size per room MB glTF KTX2 | 25 | 12 | Khronos glTF Sample Models |
| Floor plan engagement lift percent | 60 | 65 | Zillow Research |
| Denoised final frame time s per 4K | 22 | 10 | NVIDIA DLSS and Intel OIDN docs |
Adoption trends across Los Angeles listings
- Adopting spatial video for social distribution. 3D cinematic b-roll in Apple Immersive Video format increases short-form reach on high-value new construction if creators follow HDR PQ mastering and 8K capture rules [Apple Developer].
- Extending photorealism to daylight-accurate exteriors. Sky models match LA turbidity values and aerosol profiles for true shadows on pools and decks if render engines support Hosek-Wilkie or Perez models in PBR [Academic references].
- Elevating curb appeal with neural materials. Generative PBR maps refine stucco, board formed concrete, and Spanish tile if QA compares bumps and roughness to site photography at 1 m scale.
- Expanding accessibility features inside tours. Keyboard navigation, alt text on hotspots, and voice prompts raise usability if WCAG 2.2 AA conformance guides annotations on every scene [W3C].
- Connecting CRM data to on-tour actions. Lead scoring ranks high intent viewers who inspect HVAC closets and EV chargers if APIs map events to contact timelines in HubSpot or Salesforce.
Vendor readiness signals for Best 3d Architectural visualization
- Demonstrating USD based lookdev on LA specific materials like white oak, plaster, and Corten.
- Delivering glTF 2.0 with EXT_meshopt_compression for web tours and Revit to USD workflows for architects.
- Proving cloud render stacks with 60 ms motion to photon on 5G in Westside, DTLA, and Valley test routes.
- Apple Vision Pro Tech Specs, developer.apple.com
- NVIDIA CloudXR, developer.nvidia.com
- Khronos glTF 2.0, khronos.org
- Shopify Web Vitals, web.dev
- Zillow Research on 3D Home, zillow.com
- W3C WCAG 2.2, w3.org
- LADBS Code Resources, ladbs.org


